core concepts
Logs
Overview of Log types and how to query them.
Overview
Noop logs everything. From activity on Traffic Endpoints all the way down to the Service Instances, every part of your Application is observable through the logs.
Logs are accessible from the Noop Console. Each page has a panel showing the associated logstream open to the live tail. It’s possible to query the log view by specific date, time, and content criteria (such as error conditions).
All Noop logs are structured as JSON and can be filtered with Noop Logic. See the log filtering docs for an overview of how to query the logs. When you output your own logs in JSON format, they also become queryable with Logic.
Noop also supports full-text search for all logs.
Live Tailing
When viewing recent logs without specifying an end time, Noop will automatically tail and stream the log events to you.
Log types
Build Logs
A Noop Build is the build phase of every Component within an Application. Builds are accessible from the Application Dashboard page.
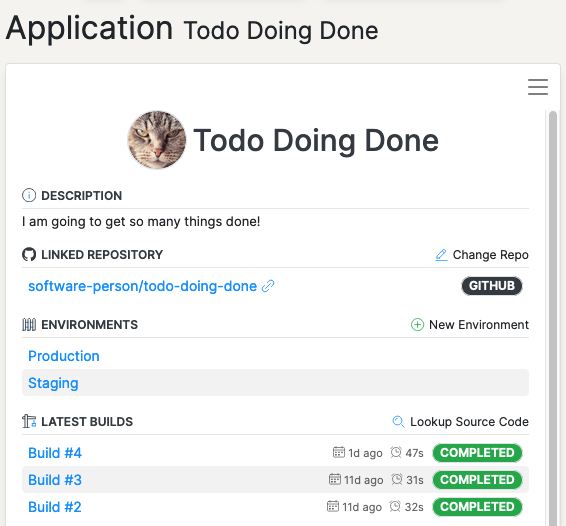
The Build logs show the output of each Component build. Build logs can be filtered to an individual Component using the log filter function.
To filter logs by a component, click a line in the log from the desired component. Hover over the “component” property and click the three stacked horizontal lines to the left.
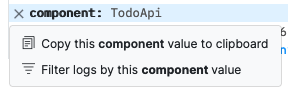
Click “Filter logs by this Component value”. This will update the log view to show only the logs from that specific component.
Traffic Endpoint Logs
Here you will see all requests to your public Endpoints. Each request to the Endpoint will show the request itself, the rule that handled the request, and the response.
The most common Traffic log sequence will show traffic.request, traffic.forward, and traffic.response events.
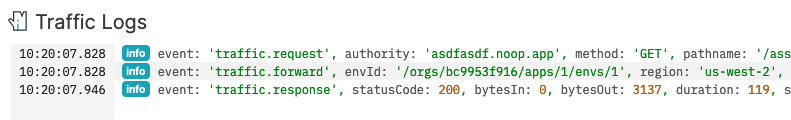
Traffic forward is the event type indicating traffic sent to an Application Environment. See Traffic and Routing for details on how traffic is resolved.
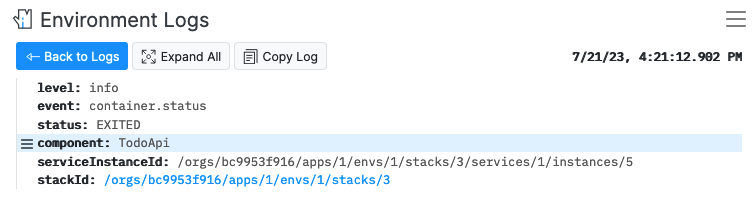
Environment Logs
Environment logs are an aggregate view of all Component output and Environment Traffic logs. Environment logs are available on the Monitoring page.
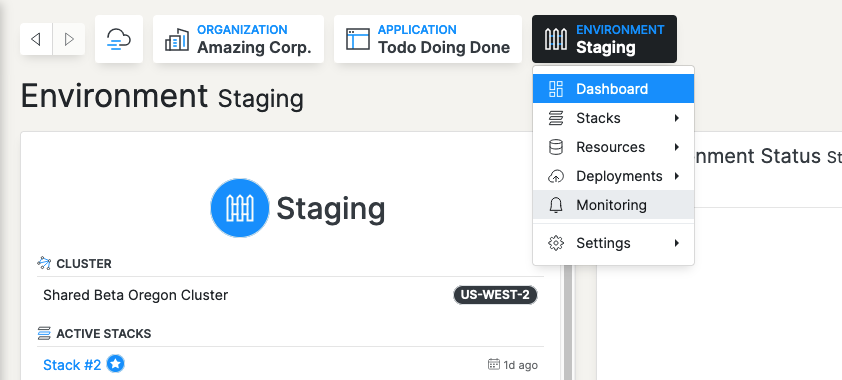
From this view, it’s possible to filter logs by a specific time range, Stack, Component, Instance, or any other filter criteria available from the JSON output of the logs themselves.
In addition to the high-level Environment Log view, there are three other useful Log entry points: Stacks, Components, and Service Instance Logs. Each of these views is a filter of the top-level Environment Log. Note: it’s possible to create the same filter for each of these views from the Monitoring page.
Opening the Log filter menu on each of these pages will show the exact filter that was applied to the Environment Logs.
Stack Logs
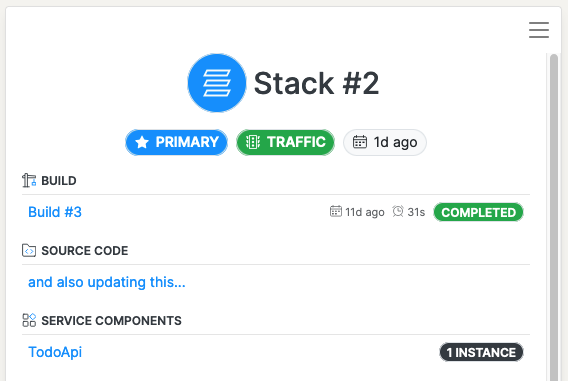
This is the aggregate view of logs from all Services and Tasks for a given Stack (a Stack is usually representative of a unique Deployment).
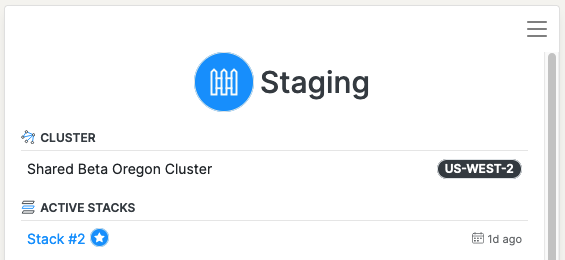
Navigate to the Stack from the Environment Dashboard page.
This is useful for identifying if an issue is related to a specific Deployment.
Stack Component Logs
All Logs of a Task or Service running within a Stack. Viewing component logs allows you to see all Component activity across the Instances of a Stack.
Navigate to the Component from the Stack Dashboard page.
Service Instance Logs
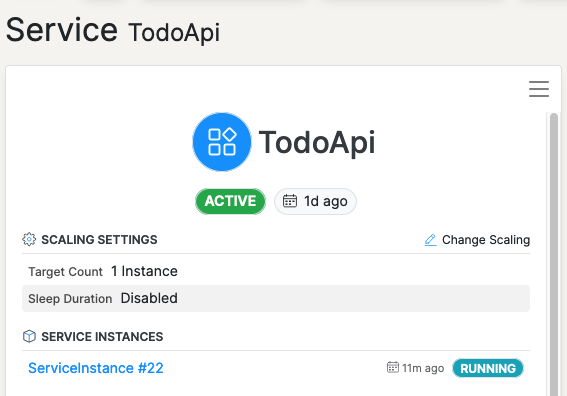
The Task or Service Logs of a particular instance. Service Instance Logs are valuable for identifying issues that are particular to a specific instance.
Navigate to the Instance from the Component Dashboard page.
Event Logs
Event Logs are intended to show an overview of activity across your Applications. Each of the three Event logs can be found on their respective dashboard pages.
Organization Events are the highest level and show all events down to the Environment level. Application and Environment Event streams are filtered views of the Organization. Below are the event types available at each level.
Organization Events
Shows events related to the Organization, they include:
- Applications
- Endpoints
- Environments
- Runbooks
- Pipeline Executions
- Builds
- Deployments
Application Events
Application Events are a filtered view of the Organization Events that relate to a specific Application. They include:
- Environments
- Runbooks
- Pipeline Executions
- Builds
- Deployments
Environment Events
Environment Events relate to a specific Application Environment. They include:
- Deployments